Needs of the Many vs the Needs of the Few: Practical Considerations for Large Scale Programming

Programming can be an inspiring process or a complete slog. Depending on your approach and circumstances, you could build innovative and exciting training plans or get stumped, spending hours trying to figure how the right combination of movements go together. Do we front or back squat? When did I put med ball throws in there? Did that change I just made fall in line with the purpose of the session? Maybe you’re stuck with constraints around physical space or less-than-ideal training environments, potentiality due to COVID restrictions. We all deal with a multitude of questions and dilemmas that dictate our programming. Like any form of art, we become our greatest source of inspiration or our own worst enemy. Programming is an important foundation to a successful program. A well-regulated or systematic approach frees up tons of mental resources to focus on other aspects of the job like more time coaching or enjoying some more time with family!
When I was working at SMU, I was alone, and rolling single-handed for a few years. When we expanded I built an internship program and I grew it to include some paid intern positions. The quantity and quality of coaching improved, lessening the coaching load that had fallen entirely on me. The programming workload, however, still fell squarely on my lap. I was stuck in a tough spot between providing the best programs for each team, accommodating each athlete’s individual needs, and having to teach and mentor around two-dozen interns. As other administrative aspects of my role continued to evolve, I continued to have less time for programming.
The pandemic created a situation which slowed everything down, giving me valuable time to innovate and catch up to our rapidly growing program. I spent weeks diving back into literature, listening to podcasts, and corresponding with other coaches around ways to adapt my approach to integrate individualization in a more systematic and efficient way. What I emerged with was an approach to large-scale programming that allowed for individualization. It took more front-end mental resources and time but allowed for a smooth sailing ship once operations resumed.
My inspiration lands massively on the shoulders of Scott Willgress from the CSCA, who shared his work around what I’ve come to adapt and call Performance Quadrants. The layout is simple, and the execution is easy to integrate into day-to-day operations if you program for large groups of athletes.
Before I dive into my method, I’d like to clarify that I don’t claim this to be the “ultimate” way to deal with large groups of athletes, but rather a simple method when you’re the sole programmer so you can free up time, the most valuable resource you have!
PART I: The Quadrants
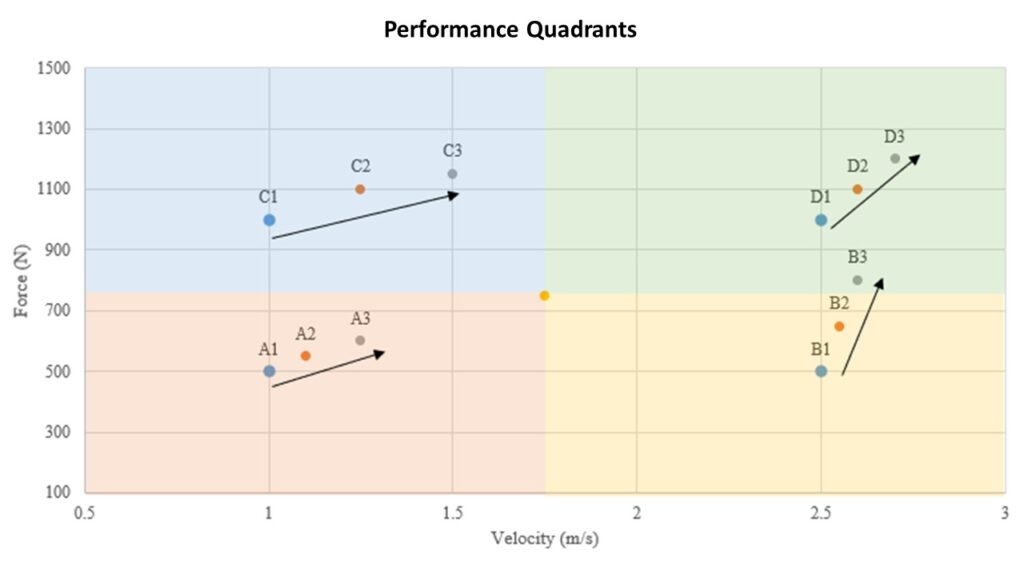
First, we created scatterplots for each athlete or team, with each quadrant marked with a color designation to allow for easier dissemination and discussion. For example: “You’re in the yellow. We need you to get your max up X pounds in the next Y time frame to get you into the green.” This approach allowed us to anchor goal setting and progression within a visible spectrum that athletes could easily understand. Keep in mind that the chart below (Figure 1) is a rough example with some mock data, but I’ll present a real example later. As soon as I rolled this out, our entire program started speaking the same language, and I was able to rapidly create and adjust programs in a fraction of the time by following a set of principles. A key piece required for this approach to work best is to collect regular or robust training data on your team(s).
- GREEN – These are athletes who are stronger and faster than their peers. These athletes can be considered “fast enough” or “strong enough” for their given sport, allowing for unique programming experiences with exceptionally developed athletes. The goal is to push them further into the upper right of the graph against their naturally diminishing returns.
- BLUE – These athletes are “strong enough” but not “fast enough” compared to their peers, requiring programming that enables them to develop or express their strength faster. We want these athletes to shift right into the green over.
- YELLOW – These athletes are “fast enough” but not “strong enough”. These are often injured athletes or those who may not be giving their complete effort. These two scenarios require very different approaches, but to reduce injury risk, we want them out of here! I like to consider the yellow a “mine-field”…
- RED/ORANGE – These athletes are weaker and less explosive than their peers. Most commonly, these will be first years or less developed seniors. The goal is straightforward – overall development!
PART II: Setting Up the Graph
Start by plotting a strength metric against a power/speed metric. I’ve tried this with several metric combinations to varying degrees of success. The most reliable combination was predicted squat or trap-bar maxes (Y-axis, either load or force) against peak jump velocity with no arm swing (X-Axis, jump height can work too). This plot provides a range of weak to strong, and less explosive to more explosive, defined based on normative data you possess (collecting your own is superior, in my opinion). To help inform different aspects of programming individualization for plyometrics and speed, I’ve looked at strength against 10-yard acceleration, flying 10’s and drop-jump relative strength index (RSI).
- First, you must create what I call the ‘Anchor’ point, which you determine by taking the group/team average for strength & power, then plotting it on a scatter plot.
- You establish the quadrants using existing team data to determine the range of your axes. There are a few ways to do this, but if you have normative data, you’re already set. 2x the standard deviation (SD) in the positive and negative directions will give you pretty good ranges. However, I encourage you to decide on specific minimums and maximums and establish why you chose them if they deviate from the SD.
- Plot your data and you’re good to go!
PART III: Using the Graph
This stage is probably the easiest, and you don’t require a ton of excel experience to figure it out (I’m by no means an excel expert). There are tons of awesome examples on YouTube, and some excellent coaches like CSCA Advisory Team member Dave McDowell, CLICK HERE, who provide excel-based resources. You can plot additional timepoints on the same graph for each athlete. I would add arrows to show an athlete’s trajectory, which was very useful for everyone to see the change visually instead of relying solely on numbers or +/- values. Below is an example of a set of athletes from last fall (Figure 2).
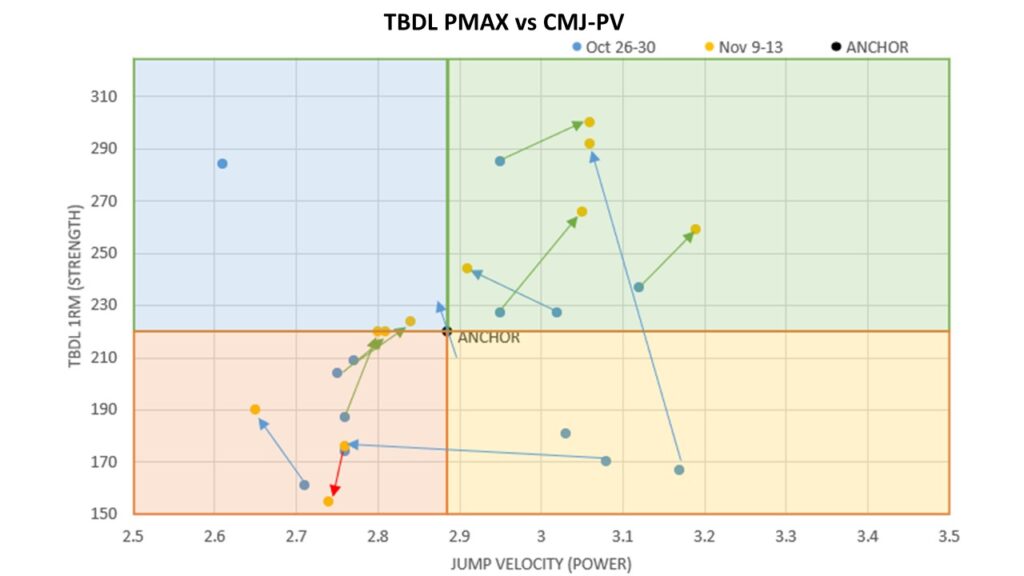
At the end of October, we communicated results to the athletes and coaching staff. From there, targets and expectations were set. In a few short weeks, we could see people generally trending in the right direction. Moving forward, we were able to focus on those who didn’t move where we expected (shifting left or down) which most times was due to fatigue on a given day, or lack of effort (or in the case of the one-off points, a missed session). You can see two examples of this, one athlete with a huge shift left (yellow to red) due to exceptional levels of fatigue, and one athlete that jumped up (yellow to green) due to holding back effort on our max effort days.
This approach became the cornerstone of reporting on a bi-weekly and monthly basis, giving the athletes feedback and increased weight-room competition. Coaches gained a better situational awareness over the progress of their athletes, and a more process-oriented approach to improving performance became part of the culture. We were able to replicate this process for all the varsity programs, painting a better visual of the overall effect we were having on performance.
PART IV: Programming
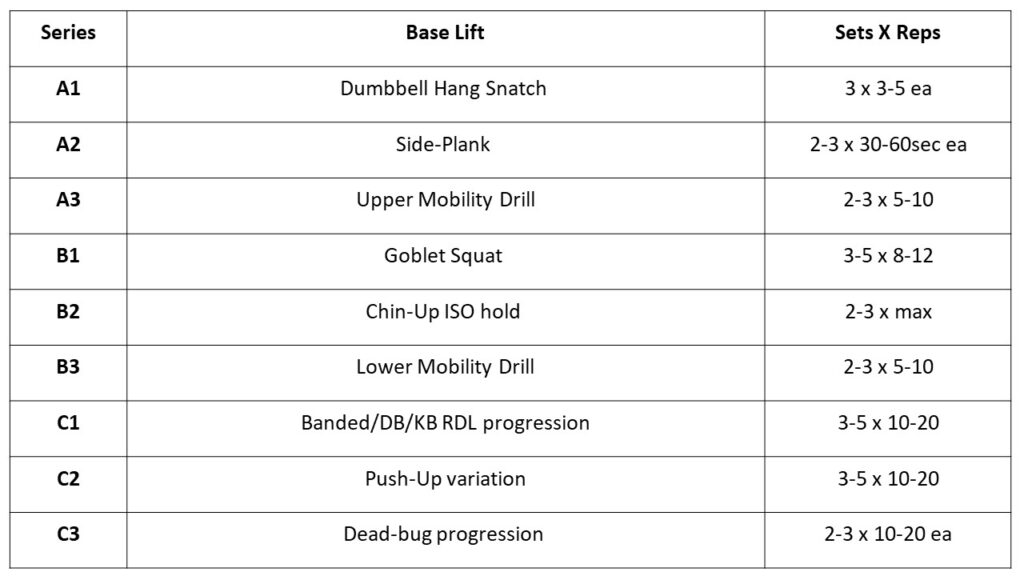
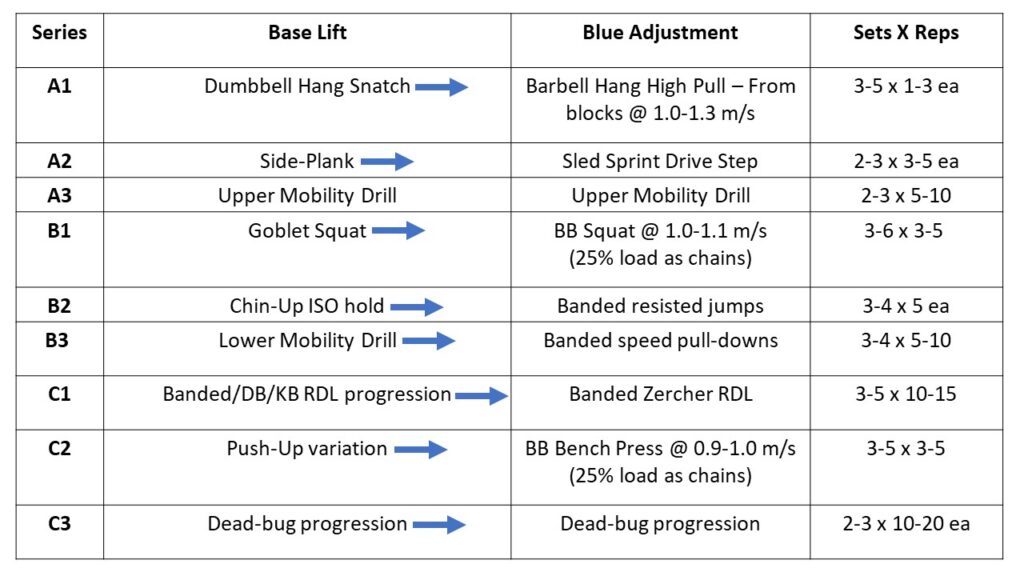
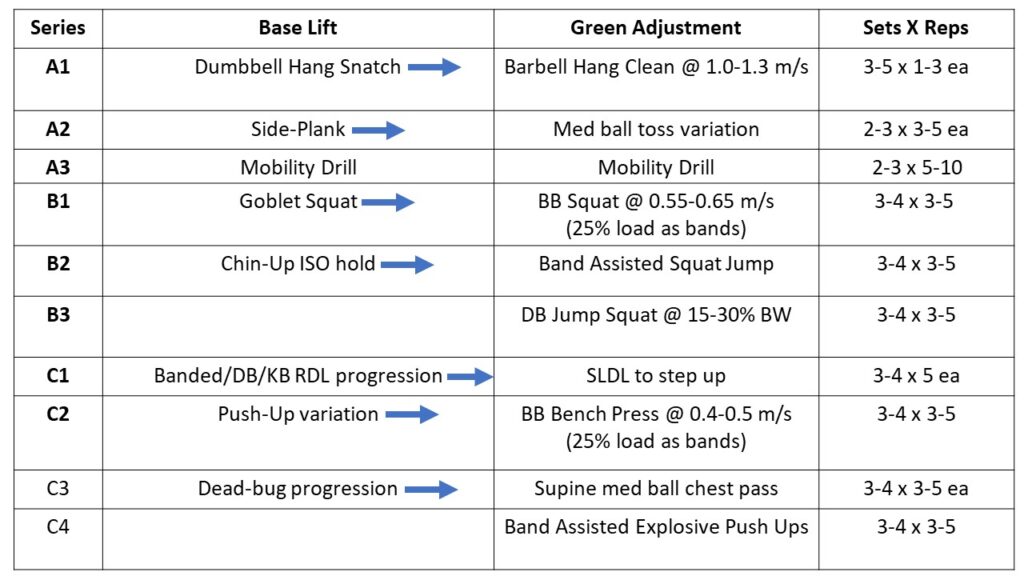
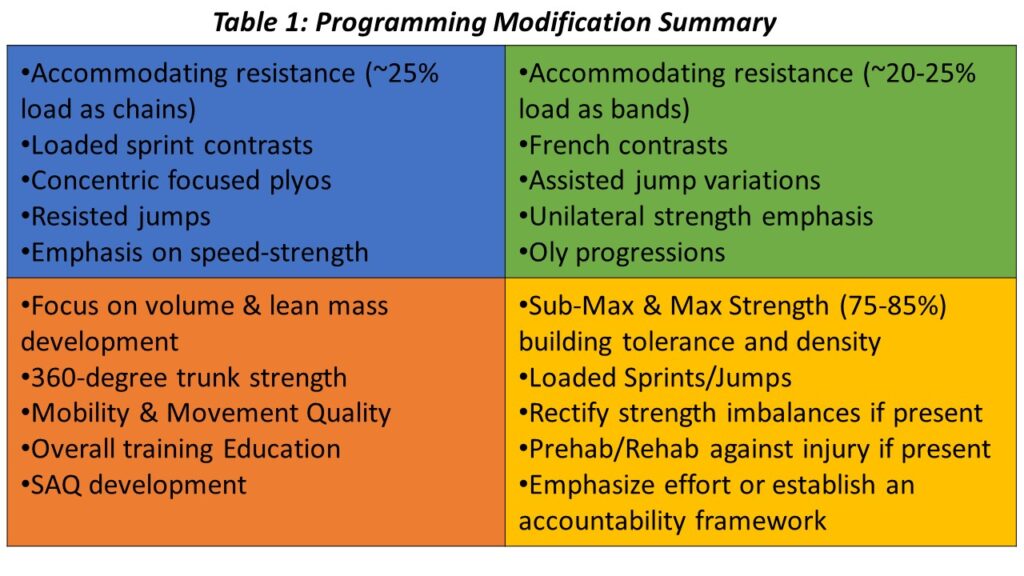
Now that I’ve gone over setting up the quadrants, we can talk about good stuff: programming. This approach allowed me to create specific training programs for each sport, which we commonly referred to as the “bones” or the “frame” of each team’s programming. Each quadrant then received a variation of that base program to account for what that category of athletes needed more of. Let’s have a look at considerations for each quadrant with some examples of what I’d change based on the athlete’s quadrant location, followed by a simple program with “rule of thumb” modifications (Table 1). These are simply guiding principles that guide programming for each quadrant, which don’t all need to be attacked at the same time, mind-you. Let’s go ahead and say we’re training during the early off-season with a basic training outline for an early week session.
RED/ORANGE QUADRANT
The red quadrant was mostly developmental, and the common approach was to introduce these athletes to higher training loads and, most often, easier regressions to certain key exercises. This programming was all about building a robust base and developing athleticism. This is typically where the “base” program would be made, with adjustments for other categories based on what was programmed here.
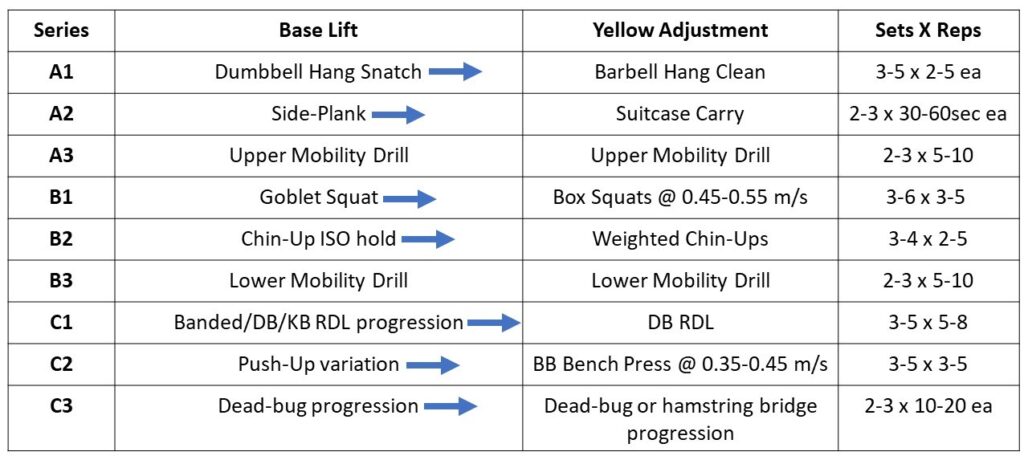
YELLOW QUADRANT
The yellow quadrant typically would see a good volume of traffic, as injury status would easily throw a green athlete down into the yellow. Typically, the athletes in this category over a longer period were excellent athletes, but never really developed strength to the same degree as their peers. We focused primarily on developing maximum strength for this population, using any method needed to get them to move heavy loads. When it came to injury, we found that people who resided in this category for too long tended to get injured, with implications that they weren’t strong enough to withstand and absorb the high-velocity movements they could output.
BLUE QUADRANT
The blue quadrant was often the least populated area when we plotted several teams. Most people’s “coaches’ eye” could tell who would be in the blue, and often with sports like football, you would tend to see offensive lineman and defensive tackles here (which eventually got their own chart, but that’s another topic altogether). Programming here was prime territory for accommodating resistance methods and resisted movements (jumping/sprinting) with a major emphasis on how fast they expressed their strength rather than building more strength.
GREEN QUADRANT
Athletes in the green commonly had more strength contrasts, higher velocity movements and advanced progressions to exercises like cleans. It was more common to have to maintain the athletes in this category, as their rate of development was more diminished compared to someone in another quadrant. We would focus on injury prevention and equalizing imbalances while increasing the challenge of the training program to get whatever more we could from their development.
PART V: Final Considerations
This method was by no means foolproof, and I will continue to work on adapting it for large-scale programming. I’ll leave you with a few things to keep in mind if you decide to use this approach.
- Have defined quadrant cut-offs. You may find an athlete hits the line between quadrants, and you need to know if the change in performance was meaningful or not before you start giving them new programming.
- The anchor point may change over time, but if you update norms at regular intervals, you’ll find that new athletes joining the team, and old ones leaving tends to keep the anchor generally in the same spot.
- Athletes even when lumped into quadrants are still different, it’s vital that you have a robust monitoring process to evaluate further differences and better inform changes you could take for each athlete.
I hope this has provided some insight and inspiration for other coaches working in high-volume training capacities. While I wouldn’t say “use the examples here”, I believe a skilled coach can take this approach and use their unique toolkit to fill in the gaps with their own programming techniques. If you’re a novice programmer – maybe this will inspire you! While there are other ways to individualize or even generalize training, I found following this method and the programming principles to be the sweet spot in providing service closer to individualization, without having to get too focused on each athlete (especially if you’re dealing with large numbers with minimal assistance and resources). I welcome questions and feedback, and good luck with the upcoming season coaches!

Erik Richard, MSc, CSCS, CEP was formerly the head strength & conditioning coach for Saint Mary’s University. While there he diligently worked to create a culture of high performance and excellence. He recently launched Richard Performance Training and continues to train athletes in the private sector.