Development and Pilot-Testing of a Smartabase-Delivered Food Frequency Monitoring Tool

Kevin Iwasa-Madge, MHSC, RD, CSCS completed a Bachelors degree at the University of Guelph in Applied Human Nutrition, and a Masters degree in Nutrition Communication at Ryerson University. Kevin is a former member of the National Wrestling Team, a registered dietitian working with the Canadian Sport Institute Ontario, a certified strength and conditioning specialist, ISAK – Level 2 accredited anthropometrist, and a coach.
Introduction
Appropriate dietary intake can promote health and sport performance1, and is determined by food choices, and eating behaviours such as timing and frequency of meals, and portion sizes of food consumed2–6. Dietary intake is difficult to quantify for a variety of reasons: eating behaviours are transient, influences on food choices are vast and constantly changing, nutrient content and density of food is variable, accurately determining portion sizes of food intake is difficult, and desirability bias in reporting is an ongoing concern7–10. Furthermore, the novelty of record keeping itself can alter dietary intake11. For these reasons, variability in actual and reported day-to-day intake can be quite large, complicating nutrition assessments.
Many available tools such as diet recalls and food logs require training to perform correctly and have high participant and practitioner burden, making them impossible for most non-nutrition practitioners to use, and unrealistic for nutritionists to use on a daily basis7,9. In practical cases, nutritionists may attempt to quantify dietary intake by assessing intake over a short period of time using one of the available tools, and hope that it is representative of overall dietary intake. Subjective daily nutrition monitoring is possible as part of an Athlete Self-Report Measures12 monitoring program. However, subjective daily nutrition monitoring is an indicator of the athlete’s perception of their diet’s nutritional adequacy, and effective use will depend on the athlete’s nutrition knowledge. Research suggests that many athletes have poor nutrition knowledge13–15. Additionally, since a subjective score is based on both perception of intake and perception of requirement, sensitivity to change in intake may be low.
It is common practice in health care settings to implement regular, sensitive screening processes, followed by more specific assessments where needed16. Relatively specific dietary intake assessments and subjective daily nutrition monitoring are available, but in many cases, neither are sensitive to change in intake. There is a need for an objective, easy-to-use tool that is sensitive to changes in intake and can be implemented on a daily basis.
Tool Development
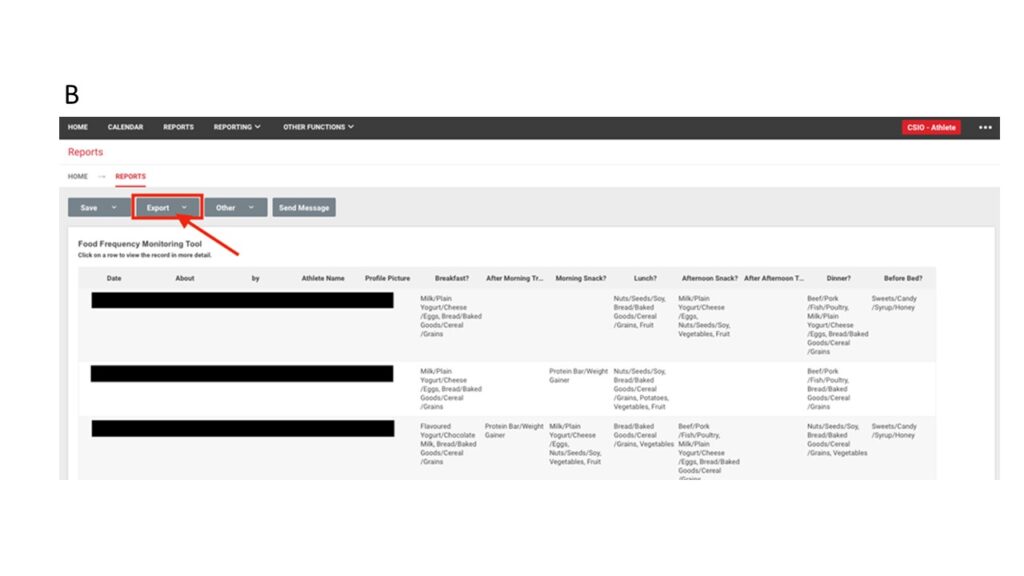
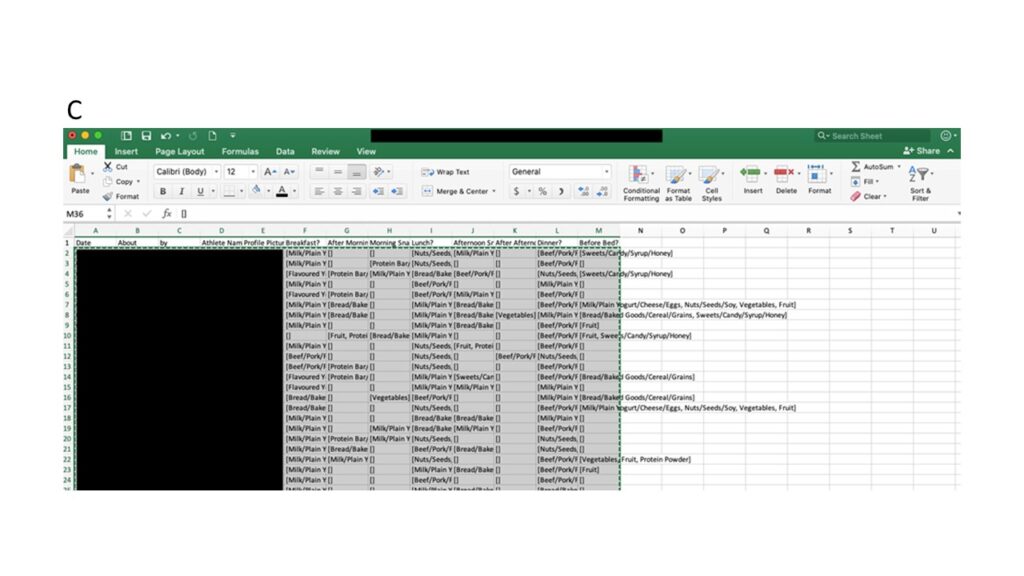
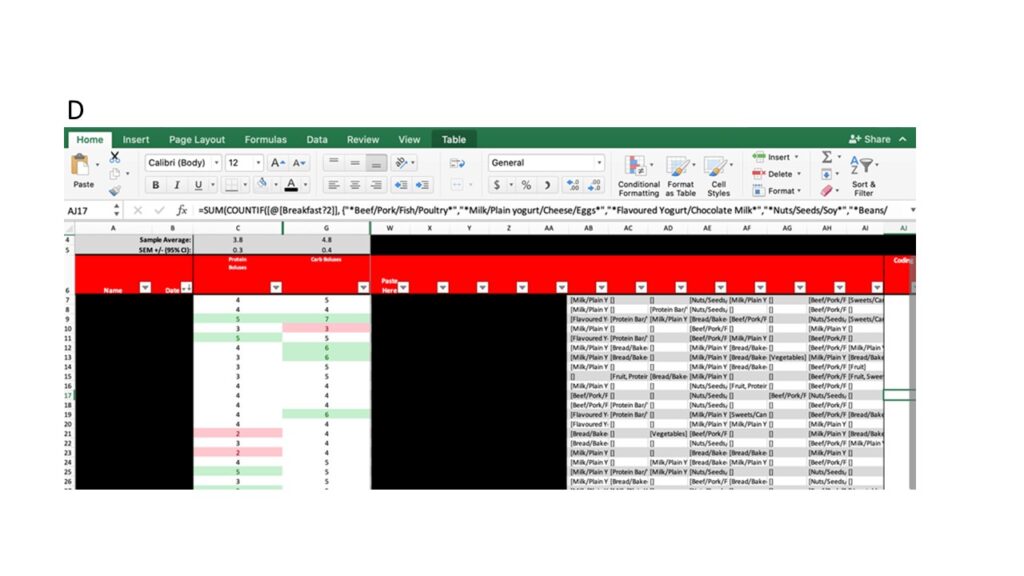
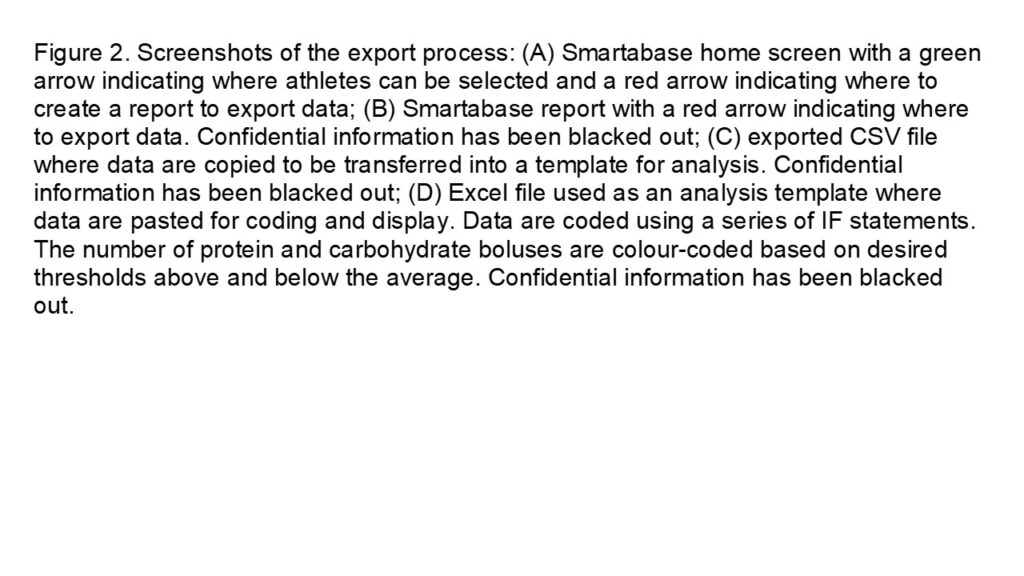
A Food Frequency Monitoring Tool (FFMT) that can be accessed on a smartphone via Fusion Sport’s athlete management system Smartabase App17 to monitor frequency-based changes in dietary intake has been developed. The FFMT operates on the assumption that intra-athlete portion sizes will remain relatively consistent, and therefore do not need to be recorded. This assumption was made to reduce the time required to complete the FFMT. Evidence of inter-day reproducibility of ad libitum energy intake during a single meal supports this assumption18,19. The FFMT is a simple form within Smartabase that consists of eight possible feeding opportunities, each with the same list of food groups that could be selected in a Select-All-That-Apply checkbox format (Figure 1). Foods were grouped based on macronutrient profile to reduce the length of the list of food. Responses can be exported from Smartabase into Excel for analysis (Figure 2a-d).
The development of the FFMT was prompted by the need for an objective, easy-to-use monitoring tool. To determine the utility of the FFMT, its validity and sensitivity to screen for changes in intake needs to be established. The purpose of this paper is to describe and discuss the results of a pilot-test comparing the FFMT to food logs from four competitive, adolescent female rugby players.
Methodology
Subjects
Data were analyzed from four competitive, Canadian, adolescent female rugby players participating in a Nationally and Provincially funded academy training program in Ontario, Canada. All subjects were 16 years of age, with mean body mass of 62.8kg (+/- 3.2kg), mean standing height of 164.3cm (+/- 5.5cm), and mean Body Mass Index of 23.3kg/m2 (+/- 1.1kg/m2). All subjects worked with a Registered Dietitian, were relatively healthy, had no apparent barriers to dietary intake, and consumed a balanced, omnivorous diet.
Procedure
Pilot testing was conducted through a retrospective design, and consent from all athletes included in the analysis was retroactively acquired upon the writing of this paper. Data collected with the FFMT and food logs between January 29th and February 24th, 2020, were reviewed. Data obtained from the FFMT on the same days as the food logs were included in the analysis, while data from days where only one tool was completed were discarded. In total, the data included in the analysis came from four athletes across 23 days. Subjects had been instructed by a Registered Dietitian on how to properly complete both the FFMT and food logs prior to completion. To standardize use, athletes were instructed to do the following: not adjust dietary intake from “normal”, only report on feeding opportunities where food was consumed, and only select food groups when the food consumed met a minimum size threshold of approximately the size of their hand (e.g. milk in coffee should not have been recorded). Responses at each feeding were coded into a protein bolus (PB) and/or carbohydrate bolus (CB) based on macronutrient profile of the foods selected. The total number of PB and CB for each day is recorded. Specific feeding opportunities, food groups, and coding criteria used in the FFMT can be found in Table 1. Food logs were reviewed with athletes and analyzed in ESHA Food Processor20 to determine daily protein intake and daily carbohydrate intake. To correct for inter-individual differences in bolus size when pooling data, average PB size and average CB size were calculated for each athlete using the number of PB and CB from the FFMT and daily protein intake and daily carbohydrate intake from the food logs, respectively. For each athlete, PB size and CB size were multiplied by their number of PB and CB, respectively, to determine a calculated-protein intake (CPI) and calculated-carbohydrate intake (CCI). Calculated intake values from each athlete were then pooled for comparison to corresponding intake values from the food logs.
Analysis
Using a Pearson Correlation Coefficient to compare pooled data, the number of PB and protein intake from food logs, and the number of CB and carbohydrate intake from food logs were analyzed. Using an Intraclass Correlation Coefficient, the CPI and protein intake from food logs, and the CCI and carbohydrate intake from food logs were analyzed. The number of PB and CPI, and the number of CB and CCI, were also compared for each athlete individually using a Pearson Correlation Coefficient.
To determine sensitivity of the calculated intake values to screen for variance in intake values determined by the food logs, the average protein intake and carbohydrate intake were calculated from pooled data. From there, delta values were created by taking the individual calculated intake values, and individual intake values from the food logs, and subtracting the average. Scatter plot quadrants were created using the individual delta values for calculated intake, and intake from food logs. Points located in quadrant 1 or 3 (top right or bottom left), show delta values for both calculated intake and intake from food logs that were directionally consistent (i.e. both positive or both negative), indicating a “true positive” screening (i.e. the FFMT captured changes that occurred on the food logs). Points located in quadrant 2 or 4 (top left or bottom right), show delta values for calculated intake and intake from food logs that were not directionally consistent, indicating a “false negative” screening (i.e. the FFMT did not capture changes that occurred on the food logs). This analysis was repeated at 5% incremental increases (up to 20%) in the minimum threshold delta value required to be considered a change from the average. Values below the threshold were considered no change from the average. Specificity of the tool was not calculated.
Results
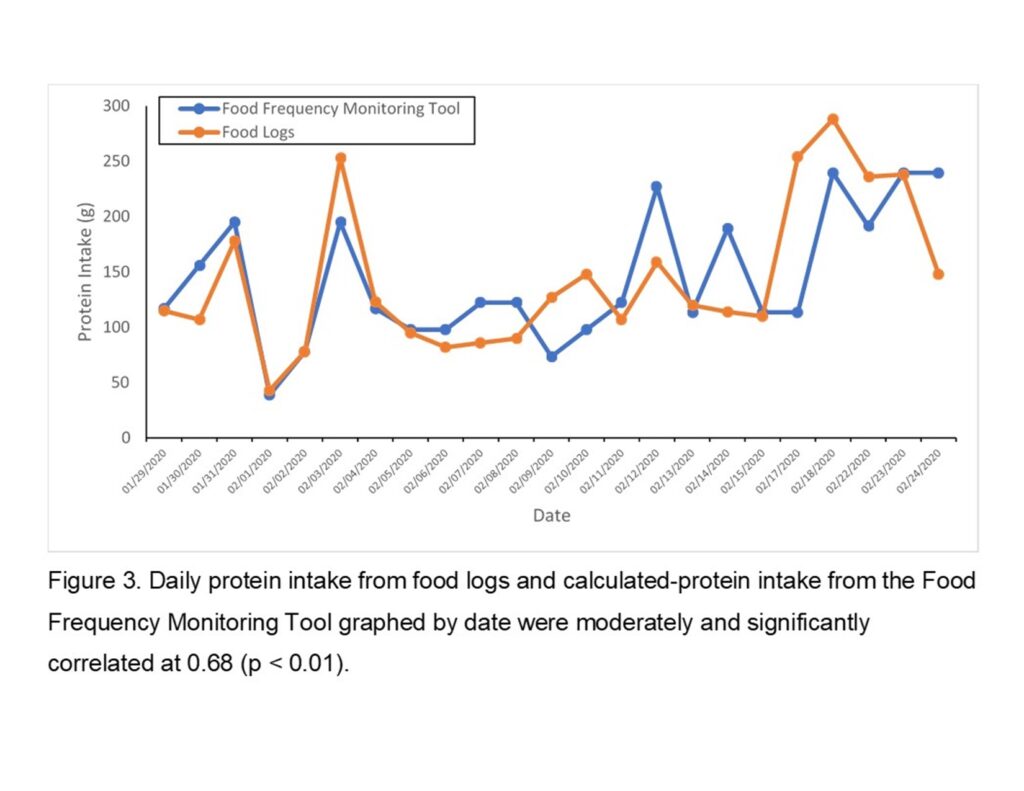
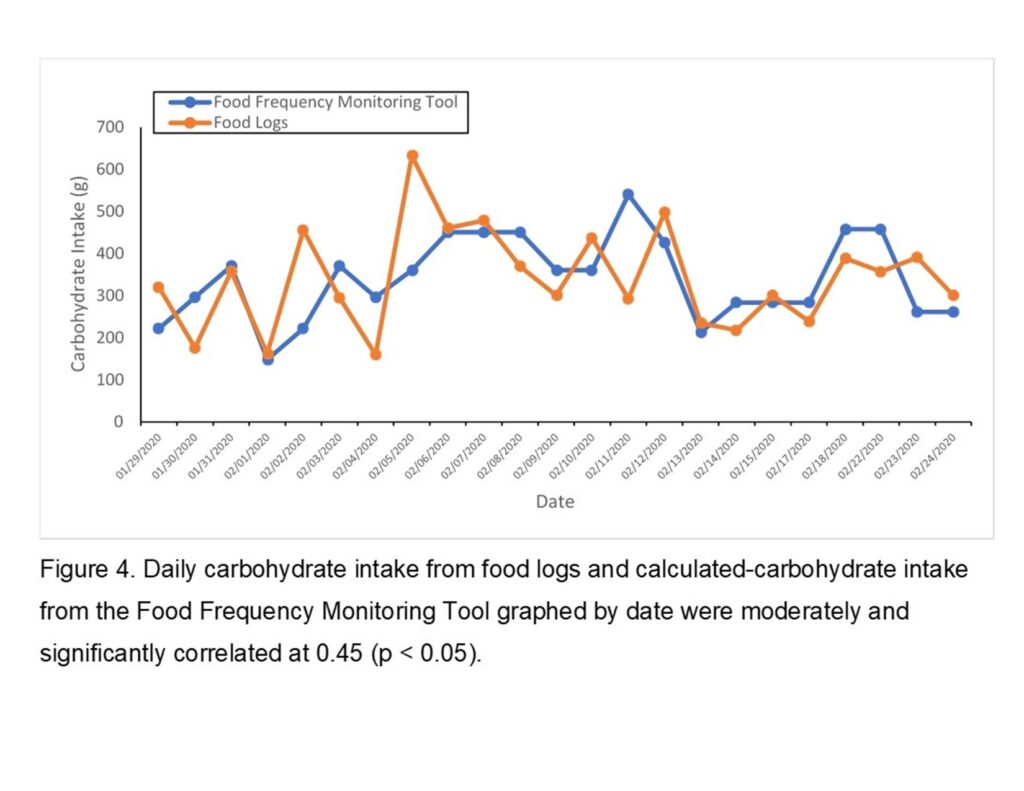
Daily completion time of the FFMT was approximately one to two minutes. Individual data and descriptive statistics can be found in Table 2 and 3. The number of PB and protein intake from food logs, and the number of CB and carbohydrate intake from food logs, were both non-significantly correlated. Calculated-protein intake and protein intake from food logs were moderately and significantly correlated at 0.68 (p < 0.01) (Figure 3), while CCI and carbohydrate intake from food logs were moderately and significantly correlated at 0.45 (p < 0.05) (Figure 4). Intra-individual correlation of the number of PB and CPI, and the number of CB and CCI, were both 1.0 for each athlete.
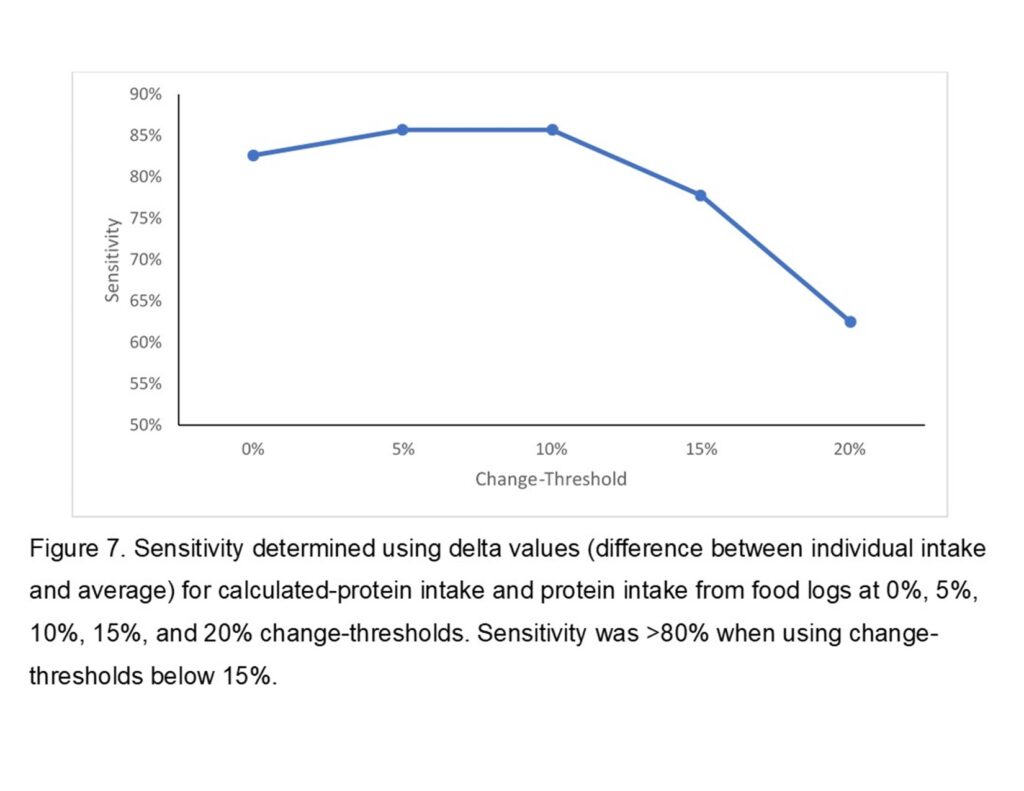
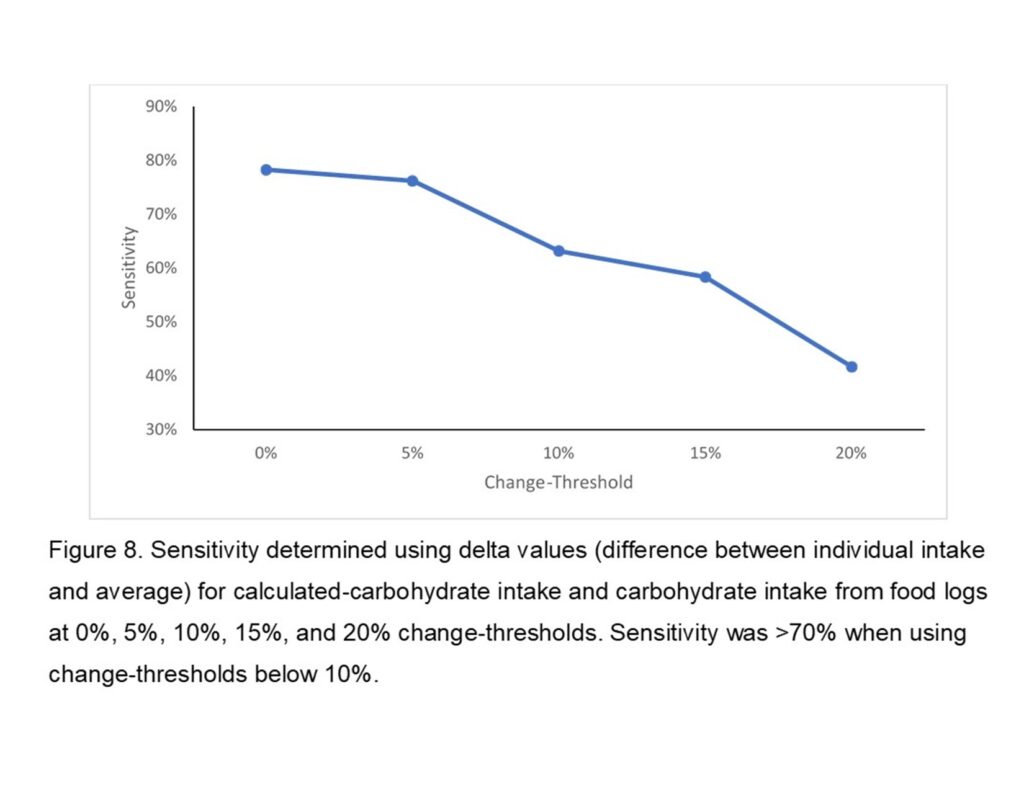
For CPI sensitivity, 19 of 23 scatter plot points were located in quadrant 1 or 3 (Figure 5), giving the FFMT an 83% sensitivity at a 0% change-threshold. If a 5% or 10% change-threshold is utilized, sensitivity is 86%. At a 15% and 20% change-threshold, sensitivity drops to 78% and 63%, respectively. Delta values for CPI and protein intake from food logs can be found in Table 4. For CCI sensitivity, 18 of 23 scatter plot points were located in quadrant 1 or 3 (Figure 6), giving the FFMT a 78% sensitivity at a 0% change-threshold. If a 5% change-threshold is utilized, sensitivity is 76%. At a 10%, 15%, and 20% change-thresholds, sensitivity drops to 63%, 58%, and 42%, respectively. Delta values for CCI and carbohydrate intake from food logs can be found in Table 5.
Discussion
The FFMT was developed to fill the need for an objective tool that is sensitive to changes in dietary intake, while pilot testing sought to explore the use and sensitivity of this newly developed tool. Calculated intake values derived from the FFMT were moderately and significantly correlated with intake values from food logs. Calculated-protein intake sensitivity was >80% when using change-thresholds below 15%, while CCI sensitivity was >70% when using change-thresholds below 10%. The FFMT is easy-to-use and time-efficient, and appears to be relatively sensitive to intra-individual, frequency-based changes in protein and carbohydrate intake under certain conditions.
Due to the declining sensitivity of the FFMT as the threshold for change increased during pilot-testing (Figure 7 and 8), the FFMT may be more appropriate for athletes with a low inter-day variance in intake. Acquiring a large enough baseline on an athlete to reduce Standard Error of Measurement (SEM) at a 95% Confidence Interval below 15% of the average number of PB may be necessary to identify real change with good sensitivity. In this study, 15% of the average number of PB was 0.6, and 15% of the average protein intake was 21g. For most athletes, reducing SEM below 15% will require a baseline average from at least one week of FFMT use, while athletes with a larger inter-day variation may require two weeks or more to confidently establish a SEM below 15%. The FFMT has poorer sensitivity to changes in carbohydrate intake compared to protein intake. Reducing SEM below 10% of the average number of CB is likely necessary to identify real change while maintaining relatively good sensitivity. In this study, 10% of the average number of CB was 0.4, and 10% of the average CHO was 34g. For most athletes, reducing SEM below 10% will require a baseline average from at least two weeks of intake, while athletes with a larger inter-day variation in intake may require one month or more to confidently establish a SEM below 10%. It should be noted that there will be a greater incidence of false negatives when monitoring for change in carbohydrate intake compared to protein intake.
Both the FFMT and subjective daily nutrition monitoring can be completed quickly and on a daily basis. However, the FFMT may be a more appropriate tool for daily use than subjective daily nutrition monitoring for athletes who have not yet received sufficient sport nutrition education (e.g. adolescent athletes), as evidence shows some lack of understanding of sport nutrition requirements prior to education21. However, sport nutrition knowledge appears to improve after several years of education22, suggesting that subjective daily nutrition monitoring may be appropriate for educated athletes. Fortunately, frequency-based nutrition recommendations are practical in adolescent populations due to the low food autonomy of many adolescents23,24, making the FFMT appropriate for monitoring these changes. As adolescent athletes get older and “graduate” from nutrition education programs, recommendations related to portion sizes may be more appropriate, and a transition to subjective daily nutrition monitoring may be warranted.
This study was limited by the sample size and demographics. As with all dietary intake data, it may be subject to desirability bias and reporting error. Food logs are not the gold standard for assessing dietary intake, and were only used as a criterion measure for practical reasons. The FFMT requires the use of Smartabase or another customizable athlete management system. Due to inter-individual differences in PB and CB size, and the use of CPI and CCI to establish sensitivity, the tool is not ideal for quantifying total protein or carbohydrate intake on its own, or for comparing protein or carbohydrate intake between athletes. If there is reason to think that PB size or CB size for an athlete has changed, such as following a nutritionist-recommended change to portion sizes, a new baseline is necessary to maintain reliability. Future research that utilizes larger sample sizes, different demographics, and validates the FFMT’s ability to capture intentional changes in intake should be performed.
Conclusion
The FFMT can be a practical and
time-efficient option to monitor for intra-individual, frequency-based changes
in protein and carbohydrate intake. The FFMT can either be used on its own for monitoring
purposes, or “calibrated” by pairing with periodic use of diet recall or food logs
to determine average PB and CB size. For those who do not have access to Smartabase
or another customizable athlete management system, data entry and coding in
Excel may be a viable approach for a limited number of athletes. The FFMT is an
ideal alternative to subjective daily nutrition monitoring for adolescent
athletes with low nutrition knowledge and/or food autonomy, or in any situation
where a frequency-based recommendation has been made. For non-nutrition
practitioners such as Sport Coaches, Strength and Conditioning Coaches,
Therapists, etc. who do not have the training or time to accurately perform diet
recalls or analyze food logs, the FFMT is a viable option to monitor frequency-based
changes in protein intake and/or carbohydrate intake during key periods such as
weight-loss, injury-recovery, hypertrophy training, or high-volume training.

References
1. Thomas DT, Erdman KA, Burke LM. Position of the Academy of Nutrition and Dietetics, Dietitians of Canada, and the American College of Sports Medicine: Nutrition and Athletic Performance. Journal of the Academy of Nutrition and Dietetics. 2016;116(3):501-528. doi:10.1016/j.jand.2015.12.006
2. Birkenhead KL, Slater G. A Review of Factors Influencing Athletes’ Food Choices. Sports Med. 2015;45(11):1511-1522. doi:10.1007/s40279-015-0372-1
3. Health Canada. Canada’s Dietary Guidelines for Health Professionals and Policy Makers. Government of Canada; 2019. Accessed July 15, 2020. https://food-guide.canada.ca/en/guidelines/
4. Stok FM, Hoffmann S, Volkert D, et al. The DONE framework: Creation, evaluation, and updating of an interdisciplinary, dynamic framework 2.0 of determinants of nutrition and eating. Matsunami H, ed. PLoS ONE. 2017;12(2):e0171077. doi:10.1371/journal.pone.0171077
5. Jastran MM, Bisogni CA, Sobal J, Blake C, Devine CM. Eating routines. Embedded, value based, modifiable, and reflective. Appetite. 2009;52(1):127-136. doi:10.1016/j.appet.2008.09.003
6. Marijn Stok F, Renner B, Allan J, et al. Dietary Behavior: An Interdisciplinary Conceptual Analysis and Taxonomy. Front Psychol. 2018;9. doi:10.3389/fpsyg.2018.01689
7. Capling L, Beck KL, Gifford JA, Slater G, Flood VM, O’Connor H. Validity of Dietary Assessment in Athletes: A Systematic Review. Nutrients. 2017;9(12). doi:10.3390/nu9121313
8. Capling L, Gifford JA, Beck KL, et al. Development of an Athlete Diet Index for Rapid Dietary Assessment of Athletes. International Journal of Sport Nutrition and Exercise Metabolism. 2019;29(6):643-650. doi:10.1123/ijsnem.2019-0098
9. Larson-Meyer DE, Woolf K, Burke L. Assessment of Nutrient Status in Athletes and the Need for Supplementation. International Journal of Sport Nutrition and Exercise Metabolism. 2018;28(2):139-158. doi:10.1123/ijsnem.2017-0338
10. Ostan R, Guidarelli G, Giampieri E, et al. Cross-Sectional Analysis of the Correlation Between Daily Nutrient Intake Assessed by 7-Day Food Records and Biomarkers of Dietary Intake Among Participants of the NU-AGE Study. Front Physiol. 2018;9. doi:10.3389/fphys.2018.01359
11. Venti CA, Votruba SB, Franks PW, Krakoff J, Salbe AD. Reproducibility of ad libitum energy intake with the use of a computerized vending machine system123. Am J Clin Nutr. 2010;91(2):343-348. doi:10.3945/ajcn.2009.28315
12. Saw AE, Main LC, Robertson S, Gastin PB. Athlete Self-Report Measure Use and Associated Psychological Alterations. Sports (Basel). 2017;5(3). doi:10.3390/sports5030054
13. Trakman GL, Forsyth A, Devlin BL, Belski R. A Systematic Review of Athletes’ and Coaches’ Nutrition Knowledge and Reflections on the Quality of Current Nutrition Knowledge Measures. Nutrients. 2016;8(9):570. doi:10.3390/nu8090570
14. Trakman GL, Forsyth A, Middleton K, et al. Australian Football Athletes Lack Awareness of Current Sport Nutrition Guidelines. International Journal of Sport Nutrition and Exercise Metabolism. 2018;28(6):644-650. doi:10.1123/ijsnem.2018-0002
15. Werner EN, Guadagni AJ, Pivarnik JM. Assessment of nutrition knowledge in division I college athletes. Journal of American College Health. Published online April 2, 2020:1-8. doi:10.1080/07448481.2020.1740234
16. Maxim LD, Niebo R, Utell MJ. Screening tests: a review with examples. Inhal Toxicol. 2014;26(13):811-828. doi:10.3109/08958378.2014.955932
17. Smartabase Athlete Management Software. Fusion Sport. Published 2020. Accessed July 15, 2020. https://www.fusionsport.com/smartabase-athlete-data-management-software/
18. Gregersen NT, Flint A, Bitz C, Blundell JE, Raben A, Astrup A. Reproducibility and power of ad libitum energy intake assessed by repeated single meals. Am J Clin Nutr. 2008;87(5):1277-1281. doi:10.1093/ajcn/87.5.1277
19. Horner KM, Byrne NM, King NA. Reproducibility of subjective appetite ratings and ad libitum test meal energy intake in overweight and obese males. Appetite. 2014;81:116-122. doi:10.1016/j.appet.2014.06.025
20. Food Processor Nutrition Analysis Software. ESHA Research. Published 2020. Accessed July 15, 2020. https://esha.com/products/food-processor/
21. Manore MM, Patton-Lopez MM, Meng Y, Wong SS. Sport Nutrition Knowledge, Behaviors and Beliefs of High School Soccer Players. Nutrients. 2017;9(4). doi:10.3390/nu9040350
22. Patton-Lopez MM, Manore MM, Branscum A, Meng Y, Wong SS. Changes in Sport Nutrition Knowledge, Attitudes/Beliefs and Behaviors Following a Two-Year Sport Nutrition Education and Life-Skills Intervention among High School Soccer Players. Nutrients. 2018;10(11). doi:10.3390/nu10111636
23. Musher-Eizenman DR, Goodman L, Roberts L, Marx J, Taylor M, Hoffmann D. An examination of food parenting practices: structure, control and autonomy promotion. Public Health Nutr. Published online December 18, 2018:1-13. doi:10.1017/S1368980018003312
24. Di Pasquale R, Rivolta A. A Conceptual Analysis of Food Parenting Practices in the Light of Self-Determination Theory: Relatedness-Enhancing, Competence-Enhancing and Autonomy-Enhancing Food Parenting Practices. Front Psychol. 2018;9:2373. doi:10.3389/fpsyg.2018.02373