Original Research: Isometric Force-time Characteristics and Test-Retest Reliability of a Rowing Specific Isometric Assessment

Abstract
A reliable means of measuring strength and RFD in key rowing positions may be valuable for those who wish to assess the impact of strength programs on force output during rowing. The purpose of this study is to investigate the isometric force –time profile and reliability of an isometric test involving a rowing specific body position.
Sixteen elite female rowers volunteered in the study. Test-retest reliability of the catch position isometric pull test (ISoRow Pull) was examined using a repeated measures design.
Test–retest reliability of the isometric pulls was calculated using the intraclass correlation coefficient (ICC) and coefficient of variation (%CV) set at 90% confidence interval. Standard error of measurement (SEM) was calculated to determine the minimum detectable change (MDC) for PF, TPF and peak RFD.
The average peak force of the two sessions was 817.6 ± 127.1N and average TPF was 630±21ms. Intraclass correlation coefficients, MDC and SEM between the two tests were r=0.98 (90% CI= 0.95-0.99) MDC=64.1N, SEM= 14.04N for PF and r= 0.67 (90% CI= 0.36-0.85) MDC 0.3s, SEM= 0.11s for TPF respectively. Coefficient of variation was 1.9% (90% CI =1.3-2.5%) for PF and 13.9% (90% CI =7.3-20.6%) for TPF. RFD at each time interval examined was highly reliable with ICC ranging from 0.96-0.99 (90% CI 0.91-1.00) and an average CV% of 2.51±0.96.
The IsoRow Pull is a reliable test of rowing specific strength that provides a potential tool for future research on the transfer of strength training to various aspects of rowing performance.
Key words: Rate of force development, Sport specific, Peak Force, Time to Peak force
INTRODUCTION
Strength training is a valuable part of a rowing program as it has been shown not only to improve measures of strength with no negative impact on aerobic performance (17), but stronger rowers are more likely to be selected to a crew for competition (18). Accurately assessing strength levels and changes in strength helps guide program development and provides a quantifiable measure of the success of the strength program. Strength testing for rowing has frequently involved traditional free weight exercises like squats, bench pulls, deadlifts, cleans, leg presses, and vertical jumps (4, 17, 18, 21). While providing valuable information for adjusting and individualizing strength programs in the weight room, traditional weightlifting based tests do not necessarily reflect the true strength requirements of rowing (20).
Muscle function tests are most valid and relevant when they reflect changes in sport specific performance, which is ideally highly quantifiable (23). The concept of movement pattern specificity in strength training has been generally supported in the literature, with the greatest improvements in performance occurring when movement pattern, speed and range of motion trained mimics the sports performance demands (22). To date only two studies many years ago have looked at strength levels of rowers using a rowing specific position, but not necessarily mimicking the rowing movements and /or speeds. Koutedakis and Sharp (16) used strain gauges and a specifically designed bench to assess the upper body strength of junior male rowers by having them pull as hard as possible with arms and trunk while the legs remained straight and braced against a footplate, a position similar to the final quarter of the drive phase of the rowing stroke. Secher (25) examined isometric rowing strength of elite Danish rowers in a position that simulated mid-drive of the rowing stroke and compared it to isometric strength of individual muscle groups. Their results further support the importance of specific body positions when using an isometric test, and of the eight muscle specific isometric strength tests only hand grip significantly correlated to rowing specific isometric strength (r= 0.43; P<0.01). More specifically, Kawamori et al (12) have suggested that joint angle and body position for an isometric test should be as close as possible to the actual dynamic movement of interest if a strong relationship between dynamic and isometric force development are expected to be seen.
The catch is the link between the recovery and drive phases of the rowing stroke. It occurs from the moment the blade of the oar enters the water until the blade is completely covered and locked into the water (24) ( http://www.worldrowing.com/photos-videos/videos/essential-sculling-technique ). The leg drive, initiated from the catch, is an important performance variable for overall technical effectiveness (14). An earlier increase in force and velocity results in a higher average boat speed and longer distance travelled per stroke (15).
Thus, a reliable means of measuring strength and rate of force development (RFD) in key rowing positions such as the catch, may be valuable for both researchers and practitioners who wish to assess the impact of strength training programs on force output during the rowing stroke. Therefore, the purpose of this study is to investigate the isometric force –time profile and determine the reliability of an isometric test involving a rowing specific body position in elite female heavyweight rowers.
METHODS
Experimental Approach to the Problem
Test-retest reliability of the catch position isometric pull (IsoRow Pull) test was examined using a repeated measures design. Athletes were asked to perform IsoRow Pull trials on two occasions seven days apart. Both tests occurred the middle of the afternoon following a standardized day off from training. Training in each week prior to the testing was similar, consisting of ~18.5 hours of total training (~4.5 hours – strength; ~10.5 hours – water rowing; ~1.5 hours – cross training; ~1.25 hours – ergometer; Remainder – stretching and rehab).
To negate any potential learning effects, all subjects recruited had previous experience with apparatus and protocol during pilot work completed 12 weeks prior to the current study. In addition, three days before testing all subjects were asked to practice the IsoRow Pull test. This re-familiarization with apparatus and procedures was achieved through performing four submaximal and two maximal pulls from their catch position.
Subjects
Sixteen elite female rowers volunteered in the study (height = 182.2±4.7 cm; weight = 81.0±6.1 kg; age= 25.1±2.7 years). All participants were full-time members of the Rowing Canada national team and completed 18-22 hours of training per week for at least four months prior to testing. Fourteen of the 16 women had competed at the 2014 World Rowing Championships as such this cohort is defined as elite. All subjects provided informed consent prior to participation in this study. The study was approved by the Canadian Sport Institute Ontario Research Ethics Board.
Procedures
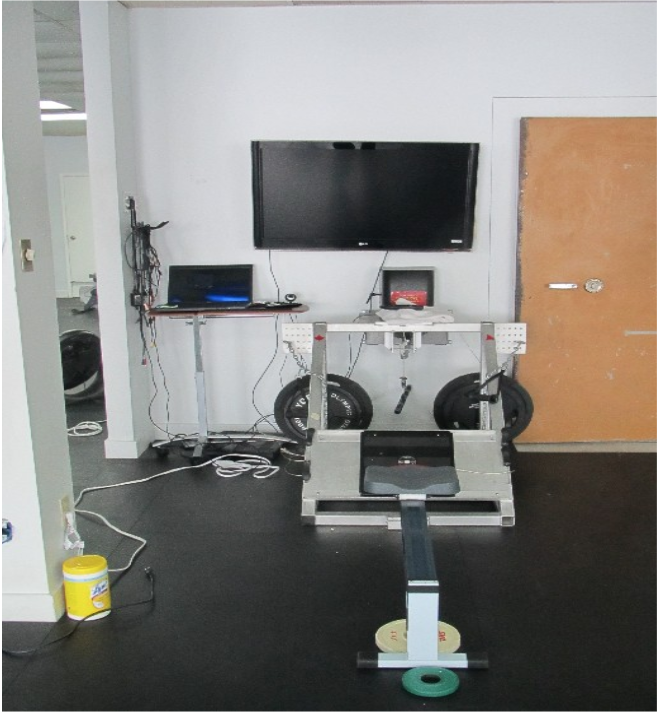
Isometric force and RFD were determined using a purpose built isometric rowing apparatus with hand and foot adjustments that allowed the subject to assume similar trunk, hip and knee positions as they would on an indoor rowing ergometer (figure 1- IsoRow). Subjects self-selected the catch position which was then visually verified by the coach. Settings of the feet and hands were noted and the same settings were used for the second test. Data was collected using a PS2142 Pasco force plate (Pasco Scientific, Roseville, CA) placed on the footplate of the isometric rack sampling at 500Hz using Pasco Capstone data acquisition and analysis software. Subjects performed four maximal isometric contractions separated by 3 minutes. They were instructed to pull as hard and as fast as possible for 4 seconds for optimal results (Haff et al, 1997). Prior to the IsoRow Pull test all subjects completed a standardised warm-up incorporating 10 minutes of dynamic stretches followed by three progressive isometric pulls that was exactly mimicked before each of the two testing sessions.
Data was smoothed using a centre weighted Savitzky-Golay algorithm of the fourth order. The best of four trials, as determined by the highest peak force, was used in all calculations. Forces normal and parallel to the force plate were measured and resultant force in the direction of the seat calculated. Force every 50ms was recorded for the first 500ms of the isometric effort. At race stroke rates the drive phase of the rowing stroke is a low as 600ms (3). Since this study was designed to look at the force profile at the catch position, which is a relatively small part of the drive phase, it was felt that 500ms is adequate to determine a rowing stroke specific RFD. Predetermined time bands have been shown to be more reliable for determining RFD (7) so rate of force development was calculated as slope of force-time Tracing from the first sustained increase of 10N from baseline to the force at the end of each of the time bands (0-50, 0-100, 0-150, 0-200, 0-250, 0-300, 0-350, 0-400, 0-450 and 0-500 millisecond). Baseline was established as the average force during a 5s ready period immediately prior to the initiation of the isometric contraction. Time to peak force (TPF) was the time from the initiation of the contraction, (i.e., the first sustained increase of 10N above baseline), until peak force was reached. Using the methods proposed by Zatsiorsky (32) the index of explosive strength (IES), the S-gradient, a characterization of the rate of force development at the beginning of a muscular effort, and the A-gradient, which is used to quantify the rate of force development in late stages of explosive efforts, were calculated using the following equations: IES = Fm/Tm where Fm is the maximum force and Tm is the time to maximum force; S-gradient = F0.5/T0.5 where F 0.5 is 50% of the maximal force and T0.5 is the time to 50% maximal force; A gradient = F 0.5/ (T max-T 0.5).
Statistical Approach
Test–retest reliability of the isometric pulls was calculated using the intraclass correlation coefficient (ICC) and coefficient of variation (%CV) set at 90% confidence interval (11). Standard error of measurement (SEM) was calculated to determine the minimum detectable change (MDC) for PF, TPF and peak RFD. The SEM was calculated by multiplying the SD of each variable by the square root of 1 minus the ICC of the variable (30). The value of 1.96 x SEM represents the 95% confidence interval (95% CI) and defines the possible range of the measurements because of error. A change greater than 1.96 x SEM represents a change that is unlikely to be the result of error and, therefore, is the MDC (27). The ICC were evaluated using the following criterion measures; poor ICC< 0.50, moderate 0.50 < ICC < 0.70, good 0.70 < ICC < 0.90, and excellent ICC > 0.90 (2). Acceptable reliability was determined as a good ICC and a CV < 15% (7). Paired T-tests were used on each time interval for RFD as well as PF and TPF to determine if there were any differences between the testing sessions. Significance was set at P≤ 0.05.
RESULTS
The average combined peak force of the two sessions was 817.6 ± 127.1N and average combined TPF was 630±21ms of the four second effort. Intraclass correlation coefficients, MDC and SEM between the two tests were r=0.98(90% CI= 0.95-0.99; p< 0.0001) MDC=64.1N, SEM= 14.04N for PF and r= 0.67 (90% CI= 0.36-0.85; p= 0.0013) MDC 0.3s, SEM= 0.11s for TPF respectively. Coefficient of variation was 1.9% (90% CI =1.3-2.5%) for PF and 13.9% (90% CI =7.3-20.6%) for TPF.
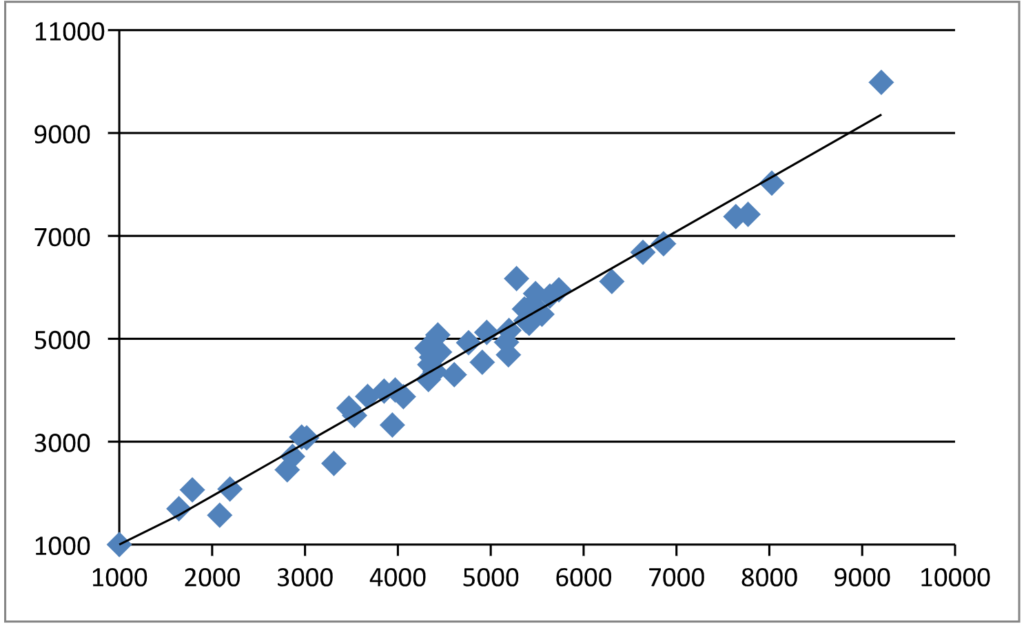
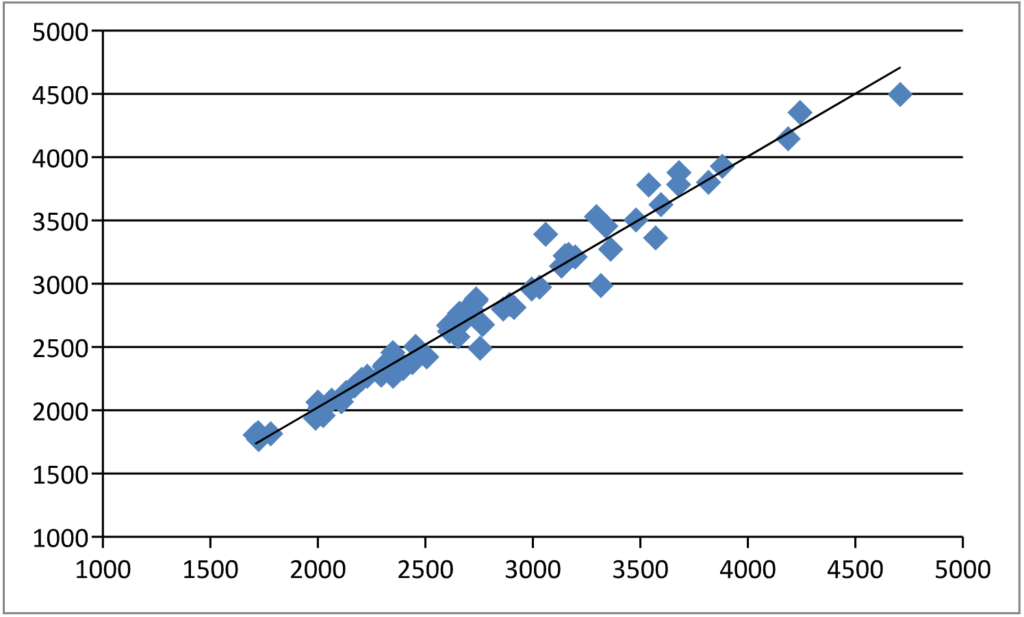
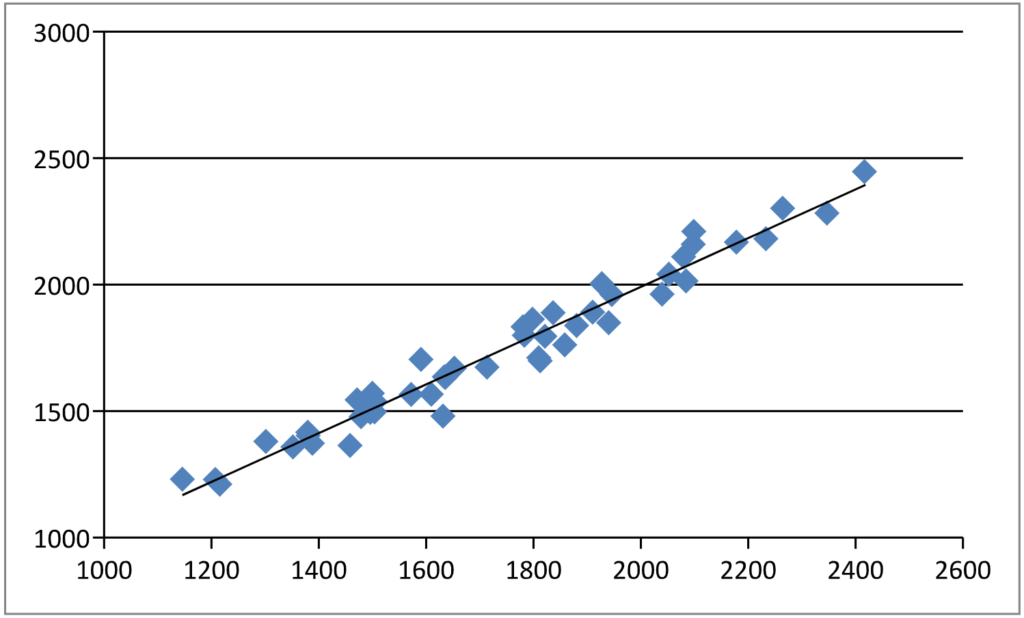
Rate of force development and reliability measures for each 50ms time period can be found in table 1. Test-retest scatter plots of early (50-150ms) middle (200-350ms) and late phases (400-500ms) of the isometric effort can be seen in figures 2-4. The S- gradient had acceptable reliability but both the IES and the A- gradient had only moderate ICCs (table 3).
Table 1. Average of Two Trials for Rate of Force Development for each 50ms interval
| Time(ms) | RFD (N·S-1) | ICC (90% CI) | CV%(90%CI) | SEM (N·S-1) | MDC (N·S-1) |
| Mean±SD | |||||
| 0-50 | 4579.59±2400.5 | 0.99 (0.98-1.00) | 4.6 (2.1-7.1) | 266.2 | 738.0[TS1] |
| 0-100 | 5025.34±1599.9 | 0.99 (0.98-1.00) | 3.5(1.7-5.3) | 234.1 | 648.8 |
| 0-150 | 4320.95±803.9 | 0.96(0.91-0.98) | 3.0(1.9-3.9) | 163.6 | 453.4 |
| 0-200 | 3522.06±584.1 | 0.96(0.91-0.98) | 3.1(2.2-4.0) | 120.1 | 333.0 |
| 0-250 | 2911.62±416.9 | 0.97 (0.93-0.99) | 1.60.9-2.3) | 69.1 | 191.6 |
| 0-300 | 2477.54±370.6 | 0.99 (0.98-1.00) | 1.4(1.0-1.8) | 42.6 | 118.0 |
| 0-350 | 2186.42±330.7 | 0.98 (0.95-0.99) | 2.0(1.6-2.4) | 45.7 | 126.7 |
| 0-400 | 1928.65±296.6 | 0.98 (0.95-0.99) | 2.2(1.6-2.8) | 46.7 | 129.5 |
| 0-450 | 1727.26±266.0 | 0.97 (0.93-0.99) | 2.0(1.2-2.8) | 43.6 | 120.9 |
| 0-500 | 1551.45±254.2 | 0.98 (0.95-0.99) | 1.7(0.9-2.5) | 35.0 | 97.1 |
ICC = intraclass correlation; CI = confidence interval; SEM= Standard Error of Measurement; MDC= minimum detectable change
Table 2. T-Test Results for each 50ms interval
| Time(ms) | Trial 1 RFD (N·S-1) | Trial 2 RFD (N·S-1) | p (two tailed) | Mean Difference (Test 2-Test 1) | Cohen’s d |
| Mean±SD | Mean±SD | ||||
| 0-50 | 4563.26±2285.54 | 4595.92±2473.32 | 0.744 | 32.65 | 0.01 |
| 0-100 | 5014.34±1565.56 | 5036.35±1583.83 | 0.803 | 22.01 | 0.01 |
| 0-150 | 4320.25±784.36 | 4321.64±798.09 | 0.982 | 1.39 | 0.00 |
| 0-200 | 3518.97±565.15 | 3525.14±584.50 | 0.894 | 6.17 | 0.01 |
| 0-250 | 2895.04±403.78 | 2928.20±416.06 | 0.190 | 33.17 | 0.08 |
| 0-300 | 2471.06±362.83 | 2484.02±366.62 | 0.415 | 12.96 | 0.04 |
| 0-350 | 2180.01±334.88 | 2192.83±315.60 | 0.453 | 12.81 | 0.04 |
| 0-400 | 1930.26±290.49 | 1927.05±293.28 | 0.856 | -3.21 | 0.01 |
| 0-450 | 1726.34±261.60 | 1728.19±261.98 | 0.910 | 1.85 | 0.01 |
| 0-500 | 1549.81±259.56 | 1553.08±240.39 | 0.804 | 3.27 | 0.01 |
Table 3. ICC and CV for IES, S-Gradient and A-Gradient
| Variable | Trial 1 Mean±SD | Trial 2 Mean±SD | ICC (90% CI) | CV%(90% CI) | |
| IES | 1525.11±495.63 | 1314.48±454.40 | 0.66 (0.33-0.84) | 13.5(7.46-19.54) | |
| S-gradient | 5452.67±1935.63 | 5143.18±1932.83 | 0.9798 (0.95-0.99) | 7.2 (4.44-9.96) | |
| A-gradient | 911.23±343.83 | 773.40±301.47 | 0.66 (0.33-0.84) | 15.3 (8.35-22.25) | |
T-Tests revealed no significant differences between test sessions for any of the RFD time intervals (p>0.05) measures (table 2). There were no differences between trials for PF (812.81±128.59 N, 818.34±121.34 N, p=0.399) but there was a significant difference between trials for TPF (0.59±0.20s, 0.68±0.21s, p=0.025).
DISCUSSION
This study examined the test-retest reliability of the isometric PF and the force profile of elite female rowers in a position that simulates the catch position of the rowing stroke (IsoRow Pull Test). Within this experimental group, the relative reliability measures were excellent for RFD at each 50ms time period analyzed (ICCs 0.96-0.99). These correlations are in agreement with those found by Haff et al (7) using predetermined time zone bands in an isometric mid-thigh pull. Peak RFD (PRFD) occurred in the 0-100ms interval and had an ICC of 0.99 (90% CI=0.98-1.00). This is higher than the ICC range of 0.56-0.65 that Young, Haff, Newton and Shepard (31) found for various elbow angles of the isometric bench press. The authors suggested that their low ICC values for PRFD may be due to the experience level of the subjects, most of whom were primarily involved in lower body sports and may not have had as much experience with a maximal effort bench press. Studies employing subjects who use a dynamic multi-joint movement similar to the isometric test movement as a regular part of their training programs seem to produce higher ICC values. Intra-class correlations for PRFD in weightlifters performing an isometric mid-thigh pull has been shown to range from r=0.81 to r=0.96 (6, 12), while the ICC for untrained subjects performing the same test has been shown to be r=0.75 (13). In the current study all subjects were highly experienced rowers and very familiar with the body position assessed as it is a key part of the rowing stroke.
Absolute reliability of RFD (%CV) was below 5% for all time intervals (range= 1.4-4.6%). The absolute reliability tended to be lower in the first four intervals, up to 200ms, than in the rest of the test. Motivation and mental preparation have been suggested as factors in the reliability of RFD (31). It can be speculated however that while instructed to pull as hard and as fast as possible, elite endurance athlete’s cohort spend relatively little time performing maximal explosive movements and therefore, may not initiate the pull as aggressively as a speed or power athlete.
Peak force was highly reliable with a %CV = 1.9% (90% CI= 1.3-2.5). Peak force values in the current study are lower than those reported by Secher (25), the only other study to use a rowing specific position that incorporated both upper and lower body. In an equivalent level of male performer they found rowing forces of 204±3.9 kp. Gender difference in subject pools between the two studies may account for some of the difference. Male subjects have been shown to produce up to 50% more power and force on a rowing ergometer (8) and during the start of a race (26) than similar calibre female rowers and 50% more force in an isokinetic knee extension at 1.05 rad/sec (9). The current study also used the catch position compared to a mid -drive position used by Secher (25). Mid-drive which typically coincides with the highest forces in the rowing stroke (28).
The IsoRow time to peak force of 630 ±21ms was the least reliable of all the measures in this study on both absolute (ICC = 0.67; 90% CI=0.36-0.85) and relative terms (%CV= 13.9%; 90% CI= 8.0-20%) displaying only moderate reliability. As a result those variables using Tm in their calculation, the IES and A-gradient, were also not reliable. Time to peak force values were slower than the 222±23.51ms reported by Haff et al (5). This is probably due to the type of subjects in the study pool. The authors used subjects experienced with weightlifting movements. Power athletes typically produce more force and have a higher RFD in explosive efforts (10, 29) so it is not surprising that the rowers in this study produce force less quickly than subjects who regularly use explosive movements.
In conclusion, the present study suggests that the MDC in PF and RFD of an IsoRow Pull test would be the most useful tool for rowing practitioners, giving them a value against which they can assess changes from their programs to determine how much change has occurred beyond the expected variation. For a test to be useful to a practitioner it has to be sensitive enough to pick up the changes that would typically be seen through training in the group in question. For instance, a test with an MDC of 15% is not very useful if the changes typically seen through training are only 5%. Unfortunately, there is very little data available on the change in fitness or performance parameters in world class rowers. To the knowledge of this author only Lawton, Cronin, and McGuigan (18) have published data on strength changes in world class female rowers. The 9.1 ±8.5% (p=0.01) and 12.3 ±8.6% (p=0.10) changes in 5 rep leg press and a knee high isometric pull following 14 weeks of training are similar to the MDC values for peak force of 7.8% and peak RFD of 9.5% for this study, suggesting that the IsoRow Pull test examined in this study may be sensitive enough to detect strength changes in elite female rowers.
PRACTICAL APPLICATIONS
Strength testing for rowers has traditionally focused on free weight exercises involving the key musculature used in rowing but not rowing specific body positions. The current study has examined the reliability of an isometric test in a key rowing body position, the catch (IsoRow Pull). While much work still remains to be done on the relationship between specific isometric force and measures of dynamic rowing force, a reliable, easy to administer test of rowing specific strength provides a potential tool for future research on the transfer of strength training to various aspects of rowing performance and studies on the relationship between on water and off water force production.
REFERENCES
- Comfort, P, Jones, P, McMahon, J, and Newton, R. Effect of knee and trunk angle on kinetic variables during the isometric mid thigh pull: Test –retest reliability. Int J Sports Physiol Perf 10: 58-63, 2015.
- Edmondston, SJ, Wallumrød, ME, MacLéid, F, Kvamme, LS, Joebges, S, and Brabham, GC. Reliability of isometric muscle endurance tests in subjects with postural neck pain. J Manipulative Physiol Ther31: 348-354, 2008.
- Francis, P. Loads on the bodies of rowers. In: Rowing Faster. Second edition. Serious training for Serious Rowers. V. Nolte, ed. Champaign, Ill: Human Kinetics. 2011. pp. 91-106.
- Gee, TI, Olsen, PD, Berger, NJ, Golby, J, and Thompson, KG. Strength and conditioning practices in rowing. J Strength Cond Res 25: 668–682, 2011
- Haff, GG, Stone, M, O’Bryant, HS, Harman, E, Dinan, C, Johnson, R, and Han, K. Force-time dependent characteristics of dynamic and isometric muscle actions. J Strength Cond Res 11: 269–272, 1997.
- Haff, GG, Carlock, JM, Hartman, MJ, Kilgore, JL, Kawamori, N, Jackson, JR, Morris, RT, Sands, WA, and Stone, MH. Force-time curve characteristics of dynamic and isometric muscle actions of elite women Olympic weightlifters. J Strength Cond Res 19: 741–748, 2005.
- Haff, GG, Ruben, RP, Lider, J, Twine, C, and Cormie, P. A comparison of methods for determining the rate of force development during isometric mid-thigh clean pulls. J Strength Cond Res 29(2): 386–395, 2015.
- Hagerman, F. C. Physiology, and Nutrition for Rowing. In: Physiology and Nutrition for Competitive Sport: Perspectives in Exercise Science and Sports Medicine: Vol. 7: D. R. Lamb, H. G. Knuttgen, and R. Murray, eds. Indianapolis: Cooper Publishing Group, 1994. pp. 221-302.
- Hahn, A. Identification and selection of talent in Australian rowing. Excel 6: 5-11, 1990.
- Harrison, AJ, Keane, SP, and Coglan, J. Force velocity relationship and stretch-shortening cycle function in sprint and endurance athletes. J Strength Cond Res 18:473–479, 2004.
- Hopkins, WG. Measures of reliability in sports medicine and science. Sports Med 30:1-15, 2000.
- Kawamori, N, Rossi, SJ, Justice, BD, Haff, EE, Pistilli, EE, O’Bryant, HS, Stone, MH and Haff, GG. Peak force and rate of force development during isometric and dynamic mid-thigh clean pulls performed at various intensities. J Strength Cond Res 20:483–491, 2006.
- Khamoui, AV, Brown, LE, Nguyen, D, Uribe, BP, Coburn, JW, Noffal, GJ, and Tran, T. Relationship between force-time and velocity-time characteristics of dynamic and isometric muscle actions. J Strength Cond Res 25: 198–204,2011.
- Kleshnev, V. Boat acceleration, temporal structure of the stroke cycle, and effectiveness in rowing. Journal of Sports Engineering and Technology 233: 63-73, 2010.
- Kleshnev, V. Biomechanics of Rowing. In: Rowing Faster. Second edition. Serious training for Serious Rowers. V. Nolte, ed. Champaign, Ill: Human Kinetics. 2011. pp. 105-121.
- Koutedakis, Y, and Sharp, NC. A modified wingate test for measuring anaerobic work of the upper body in junior rowers. Br. J. Sports Med. 20:153-156, 1986.
- Lawton, T, Cronin, JB, and McGuigan, MR. Does extensive on-water rowing increase muscular strength and endurance? J Sports Sci 30: 533–540, 2012.
- Lawton, T, Cronin, JB, and McGuigan, MR. Factors That Affect Selection of Elite Women’ Sculling Crews. Int J Sports Physiol Perf 8: 38-43, 2013.
- Marcora, S, and Miller, MK. The effect of knee angle on the external validity of isometric measures of lower body neuromuscular function. J Sports Sci 18: 313–319, 2000
- McMaster, D, Gill, N, Cronin, JB, and McGuigan, M. A brief review of strength and ballistic assessment methodologies in sport. Sports Med 44: 603-623, 2014.
- McNeely, E, Sandler, D, and Bamel, S. Strength and power goals for competitive rowers. Strength and Conditioning Journal. 27: 2-7, 2005.
- Morrissey, M, Harman, E, and Johnson, M. Resistance training modes: specificity and effectiveness. Med Sci Sports Exerc 27:648-660, 1995.
- Murphy, A, and Wilson, G, The ability of tests of muscular function to reflect training-induced changes in performance. J Sports Sci 15: 191-200, 1997.
- Richardson, B. The Catch. In: Rowing Faster. V. Nolte ed. Champaign, Ill. Human Kinetics, 2005. pp 155-164.
- Secher, N. Isometric rowing strength of experienced and inexperienced oarsmen. Med Sci Sports Exerc 7:280-283, 1975.
- Steinacker, JM. Physiological aspects of training in rowing. Int J Sports Med 14 (Suppl. 1): S3-S10, 1993.
- Taylor, JD, Bandy, WD, and Whittemore, JD. Test–retest reliability and minimal detectable change of a novel submaximal graded exercise test in the measurement of graded exercise test duration. J Strength Cond Res 25: 1465–1469, 2011.
- Turpin, N, Guevel, A, Durand, S, and Hug, F. Fatigue related adaptations in muscle coordination during a cyclic exercise in humans. J Expl biol 214: 3305-3313, 2011.
- Ullrich, B and Bruggemann, GP. Force-generating capacities and fatigability of the quadriceps femoris in relation to different exercise modes. J Strength Cond Res 22: 1544–1555, 2008.
- Wells, G, Beaton, D, Shea, B, Boers, M, Simon, L, Strand, V, Brooks, P,and Tugwell, P. Minimal clinically important differences: Review of methods. J Rheumatol 28: 406–412, 2001.
- Young, K, Haff, G, Newton, R, and Sheppard, J. Reliability of a novel testing protocol to assess upper-body strength qualities in elite athletes. Int. J. Sports Physiol. Perform. 9: 871-875, 2014.
- Zatsiorsky, VM. Science and Practice of Strength Training. Champaign, IL: Human Kinetics, 1995.